题目
如何看SPSS配对样本T检验结果?Paired Samples Statistics Mean N Std. Deviation Std. Error MeanPair 1 VAR00001 11.8315 24 .65134 .13295 VAR00002 12.5121 24 .53025 .10824Pair 2 VAR00001 11.8315 24 .65134 .13295 VAR00003 9.6524 24 .73858 .15076Pair 3 VAR00002 12.5121 24 .53025 .10824 VAR00003 9.6524 24 .73858 .15076------------------------------------------------------------------------------------------------ Paired Samples CorrelationsN Correlation Sig.Pair 1 VAR00001 & VAR00002 24 .256 .228Pair 2 VAR00001 & VAR00003 24 .337 .107Pair 3 VAR00002 & VAR00003 24 -.101 .638---------------------------------------------------------------------------------------------------------Paired Samples Test Paired Differences95% Confidence Interval of the Difference Mean Std. Deviation Std. Error Mean Lower Upper t df Sig. (2-tailed)Pair 1 VAR00001 - VAR00002 -.68057 .72716 .14843 -.98762 -.37351 -4.585 23 .000Pair 2 VAR00001 - VAR00003 2.17907 .80319 .16395 1.83991 2.51822 13.291 23 .000Pair 3 VAR00002 - VAR00003 2.85964 .95177 .19428 2.45774 3.26153 14.719 23 .000你说的P值是最后的那个那个表的 sig(2-tailde)么? 或者看看第三个表的最后三列t df sig.(2-tailde)-27.636 24 0.0003.290 24 0.00325.108 24 0.000帮忙看看这个,t、自由度、P值分别代表什么?
如何看SPSS配对样本T检验结果?
Paired Samples Statistics
Mean N Std. Deviation Std. Error Mean
Pair 1 VAR00001 11.8315 24 .65134 .13295
VAR00002 12.5121 24 .53025 .10824
Pair 2 VAR00001 11.8315 24 .65134 .13295
VAR00003 9.6524 24 .73858 .15076
Pair 3 VAR00002 12.5121 24 .53025 .10824
VAR00003 9.6524 24 .73858 .15076
------------------------------------------------------------------------------------------------
Paired Samples Correlations
N Correlation Sig.
Pair 1 VAR00001 & VAR00002 24 .256 .228
Pair 2 VAR00001 & VAR00003 24 .337 .107
Pair 3 VAR00002 & VAR00003 24 -.101 .638
---------------------------------------------------------------------------------------------------------
Paired Samples Test
Paired Differences
95% Confidence Interval of the Difference
Mean Std. Deviation Std. Error Mean Lower Upper t df Sig. (2-tailed)
Pair 1 VAR00001 - VAR00002 -.68057 .72716 .14843 -.98762 -.37351 -4.585 23 .000
Pair 2 VAR00001 - VAR00003 2.17907 .80319 .16395 1.83991 2.51822 13.291 23 .000
Pair 3 VAR00002 - VAR00003 2.85964 .95177 .19428 2.45774 3.26153 14.719 23 .000
你说的P值是最后的那个那个表的 sig(2-tailde)么?
或者看看第三个表的最后三列
t df sig.(2-tailde)
-27.636 24 0.000
3.290 24 0.003
25.108 24 0.000
帮忙看看这个,t、自由度、P值分别代表什么?
题目解答
答案
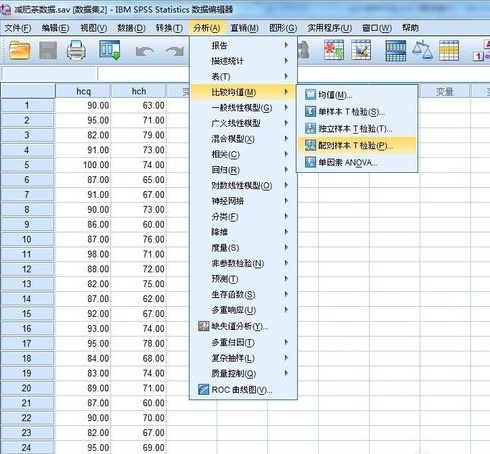
1.调出相关操作窗口,具体操作见图片。
2.置信区间默认的是95%,缺失值的处理方法任然是第一种方法。
3.第一个表格是数据的基本描述。
第二个是数据前后变化的相关系数,那个概率P值是相关系数的概率值,概率大于显著性水平0.05,则说明数据变化前后没有显著的线性变化,线性相关程度较弱。